Referral early-warning analytics for community medical imaging
Bellwether reads your monthly referral export and identifies referring clinicians whose volume is declining, while there is still time to act on it.
Each month it returns a written summary of what changed, an outreach queue that puts the reason beside each name and orders it by the referrals at stake, and a printed briefing page for each office visit. Underneath sit volume tracking by clinician and by clinic, six early-warning signals, a percentage chance of going quiet for each clinician (checked against what actually happened), and a six-month volume forecast. It runs on one export a month from the system you already use.
Of the clinicians it flagged in the production deployment, 76 in 100 went on to decline or go quiet, judged only against months the model had not yet seen, on data through July 2026. The full table of accuracy measures is below, with what each one means beside it. The demo is that software running on a synthetic panel.
Access is by email: samuel.putra101@gmail.comRequests are answered by a person within one business day.

How referral loss happens
A referring relationship ends without an event. A clinician retires, an office changes how it routes referrals, or it begins sending to a nearer provider. None of these produce a notification, and the change is visible in a monthly total only after it has been under way for some time.
Below is a single referring clinician over three years. They sent between twelve and twenty a month for two and a half years, then tapered, then stopped. The decline is roughly one percent of a mid-size clinic's volume, so it does not stand out in a monthly total while it is under way.
- Recent pace
- ·
- Their baseline
- ·
- At risk, 12mo
- ·
Referring on their usual rhythm.
At-risk is their baseline pace carried forward twelve months, discounted 32% for the share of flagged relationships that went on to recover when the production deployment's past flags were graded against what followed. The product applies and publishes the same discount. Drag to move through their history. This runs a simplified version of the real signal logic in your browser, without the terms the product adds for each clinician's own variability, the season, and how the rest of their clinic moved. Nothing is sent anywhere.
A week of use
The output is shaped for the person making the visit: a printed page per office, with the reason each name is on it.

The Brief
What moved since the last data load: who newly slipped, who eased off, who came back, and which clinician sent their first ever referral last month.
The queue
Ranked by what is at stake, grouped by clinic when the visit is to an office rather than a person. Mark contacted, snooze, dismiss. The team shares one live list.
The visit briefing
One printed page per office: who is slipping and why, the numbers behind it, the recent contact history, and blank lines for notes.
The grade
The calls made last quarter come back scored against what actually happened, so the outreach effort has a measured result.
The six signals
Each signal was built and backtested against later outcomes before it was included. Thresholds are absolute, never relative to whoever else happens to be on the list this month, so a good month for the panel cannot hide a bad month for one clinician.
Cadence break
A clinician who refers on a steady rhythm has missed it. Silence has to reach at least twice their own median gap between referrals, and never less than two months, so a monthly referrer and a quarterly one are judged differently. The threshold also accounts for their calendar: when a clinician's own history shows the same months quiet year after year, silence in those months raises the bar by that overlap, up to three months, so an annual break is not flagged mid-break while silence that outlives the usual window still is. baseline anchored to their last active month, so silence cannot decay it; recurring quiet seasons learned from two or more of the clinician's own years
Slippage
Recent volume has fallen below their own established baseline, and stayed there across two consecutive monthly snapshots rather than one noisy reading. requires two snapshots; single-month dips are ignored
Deceleration
The decline is getting steeper rather than levelling off. It never flags a clinician on its own; it corroborates another signal. corroborating only, needs a material below-baseline decline
Below expected
They are running under what their own history predicts for this month, after the season and their clinic's overall movement are both accounted for. exact Poisson / negative-binomial lower tail
Erosion
A clinician who is still active but running at half their best sustained pace and continuing to decline. The silence signals do not cover this case, because the clinician never goes quiet. 50% of the best 12 of the trailing 24 months, a non-decaying baseline
Sparse break
For the surgeon or physiotherapist who sends one to five a year, a monthly rhythm cannot be read. How long they have currently gone without sending is compared against their own past gaps instead. flags when the current gap outlasts nine in ten of their own past gaps; the threshold is steadied against senders of similar volume
A flagged clinician also carries a read on whether the drop is theirs alone. If their whole clinic dipped together, the entry is pushed down the queue. If they fell while their colleagues held steady, it is pushed up. In backtests, isolated drops preceded real loss about two times in three; clinic-wide dips, about one in ten.
Doing this without software
Clinics generally track referrers in one of three ways: not at all, on a spreadsheet kept by an office manager, or through a dashboard built on the same monthly export. All three cost less than this does. Two of them share a specific limitation, described below.
Month-over-month comparison
A doctor who usually sends six a month sends three. On a sheet that is a fifty percent drop and it goes on the call list. At six a month, though, three is within their ordinary variation, so the flag is noise.
A doctor who usually sends forty sends thirty-two. That twenty percent dip is easy to scroll past, and at that volume it is a real signal. Judged against each clinician's own history and variability, the second case matters and the first does not, which is the reverse of how the two read by eye. Across two hundred referrers that is a large amount of arithmetic to hold consistently.
Detecting absence
A clinician who stops referring stops appearing in the export, so noticing them on a sheet requires already suspecting they are gone. Every signal here is built to detect that absence: the queue lists the clinicians whose referrals have slowed or stopped arriving.
Name variants cost time to reconcile by hand. The same clinician arrives as Smith, J. / J Smith MD / SMITH JOHN, and until those are one person every total is wrong. Bellwether catches the variants at upload and merges them only when you confirm it.
The outreach queue
The queue is ordered by how many referrals are at risk over the next twelve months, discounted by how often declines of this shape actually persisted in past data. Your export records that a referral happened, not which procedure was booked, so referral counts are not multiplied by an assumed fee. Where the clinic provides its fee schedule, the same at-risk counts are also shown in fee-schedule dollars, labelled as such.

Measured accuracy
Bellwether publishes how often its own scores have been right. Every figure below is measured against outcomes the model had not seen when it made each prediction, and the product grades its own past flags on a Track Record page inside the app, re-graded with every data load.
| Measure | Result | Gate | What it means |
|---|---|---|---|
| Ranking accuracy (AUC) | 0.90 | min 0.85 | Pick a clinician who later went quiet and one who did not. The score orders them correctly 90% of the time. |
| Watchlist precision | 76% | min 70% | Of everyone the queue flagged, this share genuinely declined or went silent. |
| Calibration error | 0.013 | max 0.05 | When it says a 30% chance of going quiet, it happens about 30% of the time. Uncalibrated, that error was 0.19. |
| Volume at risk | r = 0.85 | min 0.60 | Predicted referrals at risk against what was actually lost twelve months later. |
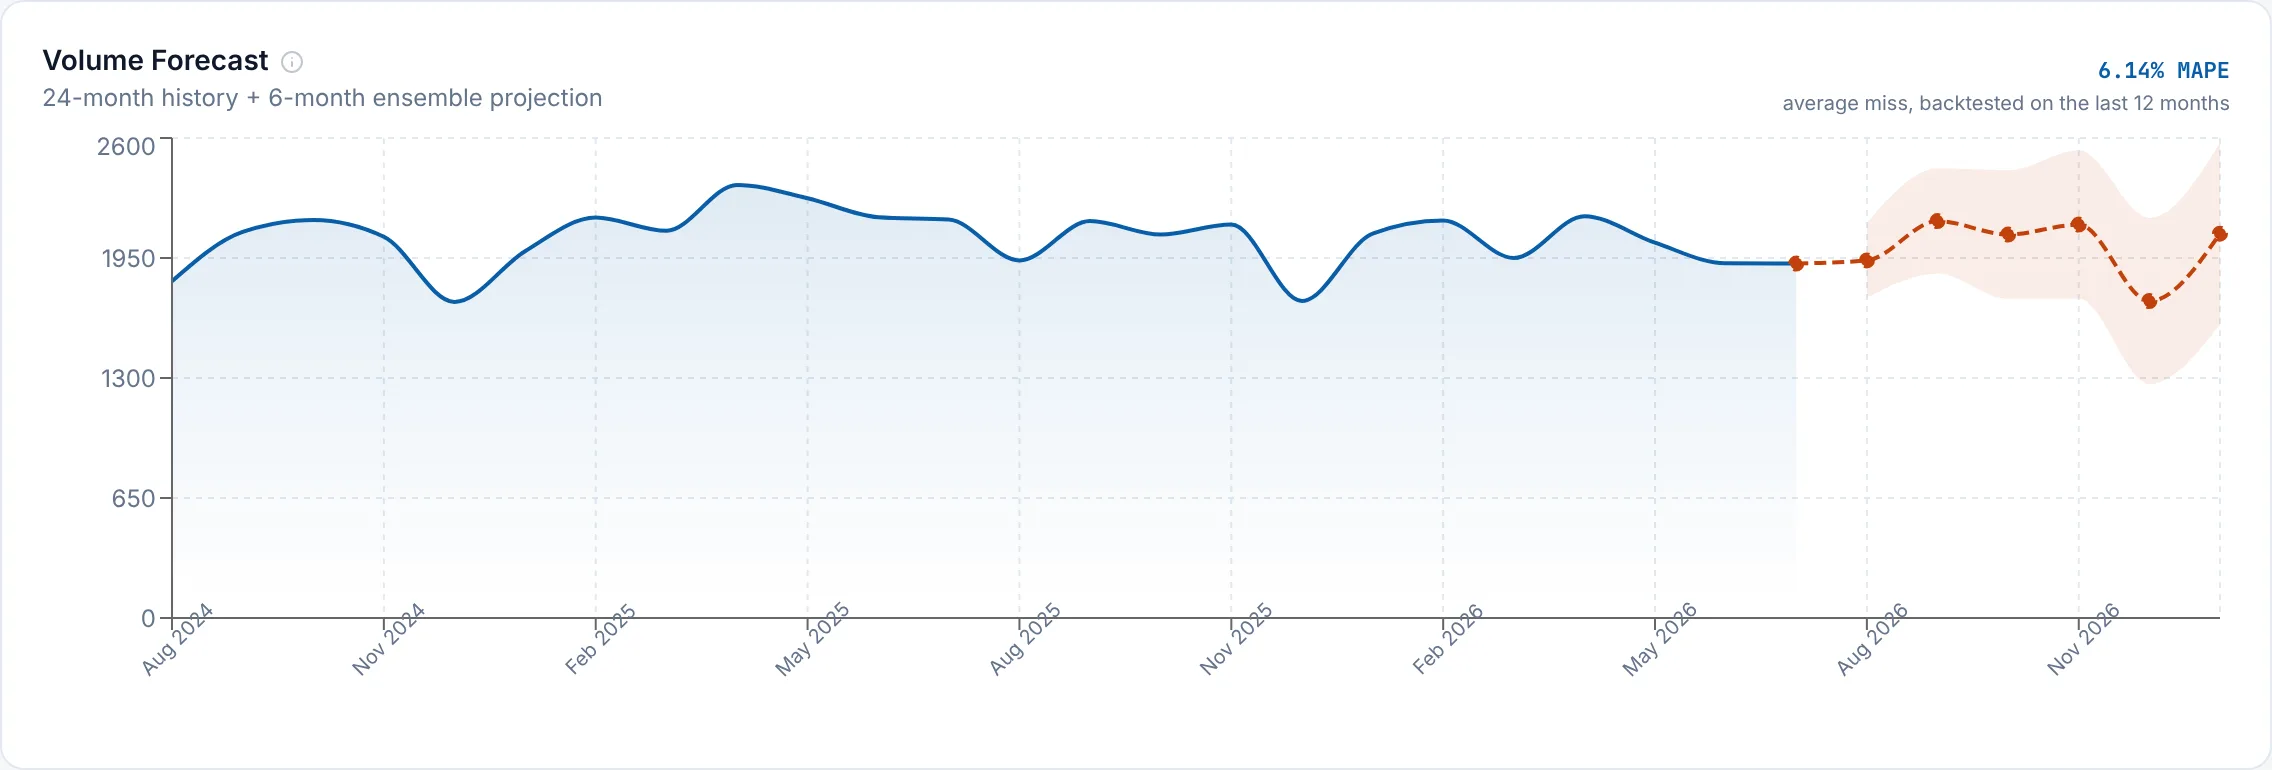
| Forecast error | 10.5% | max 20% | Average miss on the six-month clinic volume forecast. |
Measured on the production deployment: a community imaging clinic in Alberta, roughly a thousand referring clinicians and more than six years of monthly history, in production since March 2026. The level shown is the last accepted measurement, recorded 2026-08-25 on data through July 2026; the same checks re-run on every data load. Rolling-origin backtest, the model is rebuilt at a series of past cutoff dates and graded only against months it had never seen. The demo runs on a synthetic panel, so the figures on its own screens are illustrative rather than these.
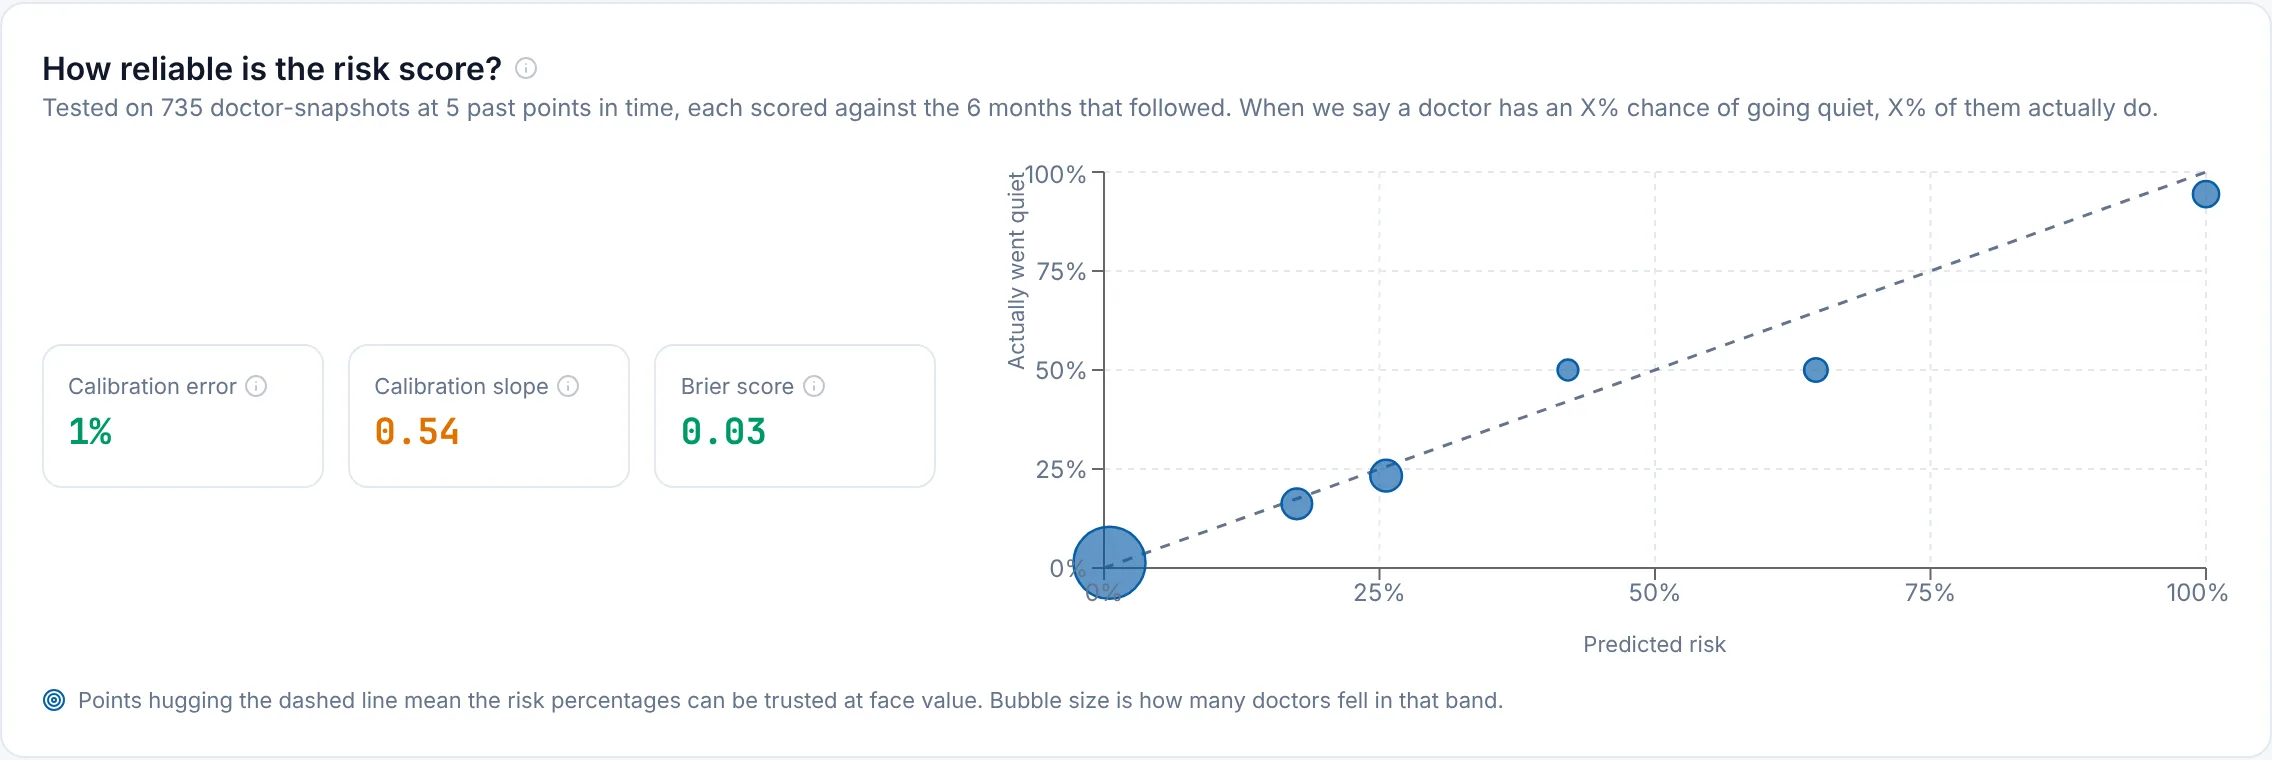
Calibration
A health score out of 100 ranks clinicians well, but it is not a probability. Dividing it by 100 and reading it as one overstated likelihood by a factor of nearly four at the top end, so the score is fitted against measured outcomes and the displayed percentage is the corrected one. The mapping is monotone: it never changes who is flagged or in what order.
Going quiet and losing volume are different failures. A busy clinician sliding from forty a month to twenty can carry a low chance of going silent and a large volume at risk at the same time. Both numbers are shown, because each identifies a different kind of loss.
The prediction ledger
On each data load, Bellwether appends its live claims to a ledger: who is flagged, the baseline each was judged against, the stated chance of going quiet, and the six-month forecast with its bands. That file is written before anyone knows what happens next, and older entries are never rewritten.
Months later, the Brief grades them against what actually occurred: recovered, went quiet, still declining. Because the claims are recorded before the outcome exists, the grades cannot be revised in hindsight.
Accuracy gates
In the production deployment, every code and data change re-runs these measurements automatically, and the checks fail if any measure crosses the gate in the table above. A fixed gate catches only a large drop, so a second check compares each result against the last human-approved level and fails on smaller drift, even while a number still clears its gate. Changing that reference level is a recorded change that a person reviews; a data load or code change cannot move it in passing.
One export a month
Setup requires no integration project, interface engine, on-site server, or access to patient records at any point.
- →An export from whatever you already run. Long-format claim exports are converted to monthly counts on upload, and the upload cadence is yours to choose.
- →Referring clinician, date, modality, and a practitioner number when one is present are the only fields used. Nothing patient-identifying is read or stored.
- →Drag the file onto the update page. You get a full preview of what will change before anything is written, and a backup is kept.
- →Spelling variants of the same clinician are caught at upload and merged only when you confirm it.
- →Your team signs in with one shared password, and the dashboard runs under your own name.

Evaluation on your own export
Before any agreement, the full measurement runs on your own referral history, and you see the result before you commit.
- →A non-disclosure agreement is signed first. Then your billing or RIS system produces one export: referring clinician, service date, and modality. Long-format claim exports are accepted as they are.
- →The file is aggregated to monthly counts per clinician on receipt, and the raw export is deleted after the readout.
- →What comes back is printed on your own referrers: the monthly Brief, the outreach queue, and the accuracy table above re-measured on your history.
- →The accuracy re-measurement needs roughly three years of history, because each backtest cut-off is graded against the full twelve months that follow it. The flags themselves need about two.
Pricing
The fee is a fixed monthly amount. It does not vary with your referral volume and is not calculated as a share of billings.
| Plan | Founding rate | List rate | Who it is for |
|---|---|---|---|
| One location | $495/mo | A single imaging site. | |
| 2 to 4 locations | $995/mo | One deployment covering every site, with referrers pooled across the group. | |
| 5 to 9 locations | $1,495/mo | One deployment covering the full group, with referrers pooled across sites. | |
| 10 or more | quoted | Priced on locations and the size of your referring panel, because both are what the work scales with. Per-site filters and a site league table are built with the first multi-site client and quoted alongside that work rather than promised ahead of it. | |
| Setup | waived | Import mapping, validation against your own history, and the first drop. Waived for founding clients through December 2026; from $6,000 for a multi-site rollout. |
Founding rates are for the first three clients and are locked for as long as you stay. After that the list price applies, which is why both are printed here. Twelve month term. Where a setup fee is charged, it is refundable for any reason within sixty days; for founding clients it is waived. A quarterly readout is included at founding rates, and an optional managed monthly drop is $150. All prices are in Canadian dollars and do not include GST.
The arithmetic
A referrer sending twelve a month who stops is roughly 144 studies a year. On the BC MSP schedule that is about $5,200 a year at the chest X-ray rate ($36.41), or about $15,200 at the complete abdominal ultrasound rate ($105.62). The one-location founding rate is $5,940 a year. This is arithmetic on published fee-schedule rates and a stated example, not a forecast of what outreach recovers.
Questions
How long until it is running?
About two weeks from the day you send the first export. Most of that is us checking the import against your own data rather than anything you have to do.
Do we have to change systems?
No. Bellwether reads an export from whatever you already run, whether that is your billing system, your RIS or your PACS reporting module. The requirement is two columns: who referred and when. Modality is read when it is there: it is kept on each clinician's record and used to price at-risk referrals on your own fee schedule where that display is turned on. The signals compare each clinician against their own history and their clinic's. Nothing else is read and nothing else is kept, which is why almost any system qualifies. one system ingested in production; yours is matched against your own file at setup, before you pay
How often do we send it, and can you just pull it?
At whatever interval suits your workflow. Monthly is the usual rhythm and matches the models' monthly grain, but weekly or fortnightly is the same operation, and some offices prefer the shorter loop. A month that is still in progress is detected at upload, held out of every model, and labelled on screen, so a mid-month export does not read as a decline. If your system exposes an API we will pull on your schedule instead; building that connector is setup work, quoted before you commit.
Do you ever see patient information?
No. Long-format exports are aggregated to monthly counts per referring clinician at the moment of upload, before anything is stored, so no patient field reaches the system even in transit through it. The columns used are the referring clinician, a practitioner number when one is present (used only to unify variant spellings of the same clinician, then discarded), the service date, and the fee item or modality.
Where does our data live, and can we get it back?
In your own deployment, not a shared database with other clinics. The infrastructure is Vercel and GitHub in the United States, with the shared call list on Convex, also in the United States; what crosses the border is monthly referral counts per clinician, because no patient field exists in the system to cross it. It is a small set of monthly count files, so an export is immediate and complete, and data is deleted in full on request.
Do the accuracy numbers hold on our data?
They are re-measured on your own history at setup, and you see the result before you commit. If the models cannot clear their gates on your data we will tell you.
Why does this not already exist in Canada?
The all-payer claims datasets that make referral analytics possible in the United States have no Canadian equivalent to buy: per-physician billing records sit with the provinces and with CIHI, where access runs through a request into a secure environment, only aggregate results may leave it, and commercial use needs written authorisation. A Canadian product therefore has to be built from a clinic's own export. the same reason the product shows only your own referrers and cannot benchmark you against other clinics
Who is behind it?
Bellwether is built and run by Samuel Putra. One community imaging clinic in Alberta has run it in production since March 2026. The founding cohort is three clients because one person can onboard three clinics properly.
What this is not
The list below is what Bellwether does not do, and what it does not yet claim.
- ✕Not an EMR or a booking system. It reads an export and it never writes back to your clinical systems.
- ✕Not a patient data product. The importer aggregates to monthly counts at upload, so no patient field ever reaches storage.
- ✕Not generative AI. The written brief is assembled from fixed templates filled with measured numbers. No text about your business is generated by a language model.
- ✕Not priced per referral. The fee is a fixed monthly amount and does not vary with referral volume.
- ✕Not yet proven to change outcomes. Bellwether is measured at finding and ranking risk. Whether outreach recovers a relationship needs a comparison group assigned by lot and more than a year of flags, and Bellwether does not yet have that evidence.
Demo access
The models, thresholds, and code are the production ones, applied to a synthetic panel of 165 referring clinicians across sixteen offices, so nothing confidential is on display.